 |
| copyright: HM Queen in Right of Canada |
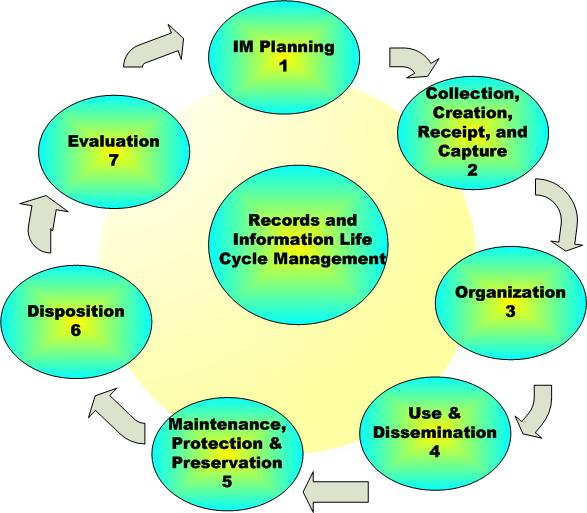
Accordingly, a year or so ago, we conducted a survey of 22 creators and users of scientific information to see which parts of the life cycle they regularly apply in the management of their own information.
Through a series of detailed questions, we asked respondents whether or not they thought each stage of the cycle was applicable to their information management needs. If it was applicable, we asked them whether or not they had planned to address that stage of the life cycle and the extent to which they had actually implemented any planned activities.
 |
| Copyright HM Queen in Right of Canada |
The survey revealed that most respondents had initiated activities to plan for information needs, collect, create, receive and capture information, organize information, and use and disseminate information. However an increasing number of respondents had not planned for the maintenance, protection and preservation of their information, the disposition of their information after they were finished with it, or to evaluate the effectiveness of their IM practices after the project was over. This was valuable information in telling us where we needed to direct our efforts.
Recently, I reanalyzed the results to better understand where we could use internal expertise to improve the management of records and information, and where we might need to draw on external expertise.
First I scored the respondents answers using the following scale: 0 = Not Applicable, 1 = Not Planned, 2 = Planned but not initiated, 3 = implemented and up to 25% complete, 4 = implemented and up to 75% complete, and 5 = implemented and 100% complete.
 |
| Copyright HM Queen in Right of Canada |
Using Chris Collison's River diagram technique, I then plotted the minimum and maximum scores among all respondents for each stage in the life cycle.The area shown in blue in the diagram above is the area between the minimum and maximum scores. The bottom bank shows the minimum level of attainment for each stage of the life cycle, the top bank shows the maximum level of attainment for each stage.
Collison suggests focusing on the widest parts of the "river" in order to leverage the most out of internal experience. The diagram shows that for stages 1 and 3 in the life cycle, everyone surveyed is at least planning to implement relevant activities for their information, therefore, these stages should not be priority areas to focus on. In stages 2, 3 and 6 some people have obtained a high degree of experience, having completed their planned activities for this stage, and it may be possible to share best practices.
For us the widest part of the river is at stages 2 and 6. By sharing their best practices or by pairing individuals who have completed their activities with those who have not even planned activities, there is great potential to raise the lower scores.
Conversely, at stage 7 there is no one who has completed all their planned activities. In this case, there is less internal expertise we can draw on and we may have to bring in external expertise to try and improve the scores.

No comments:
Post a Comment